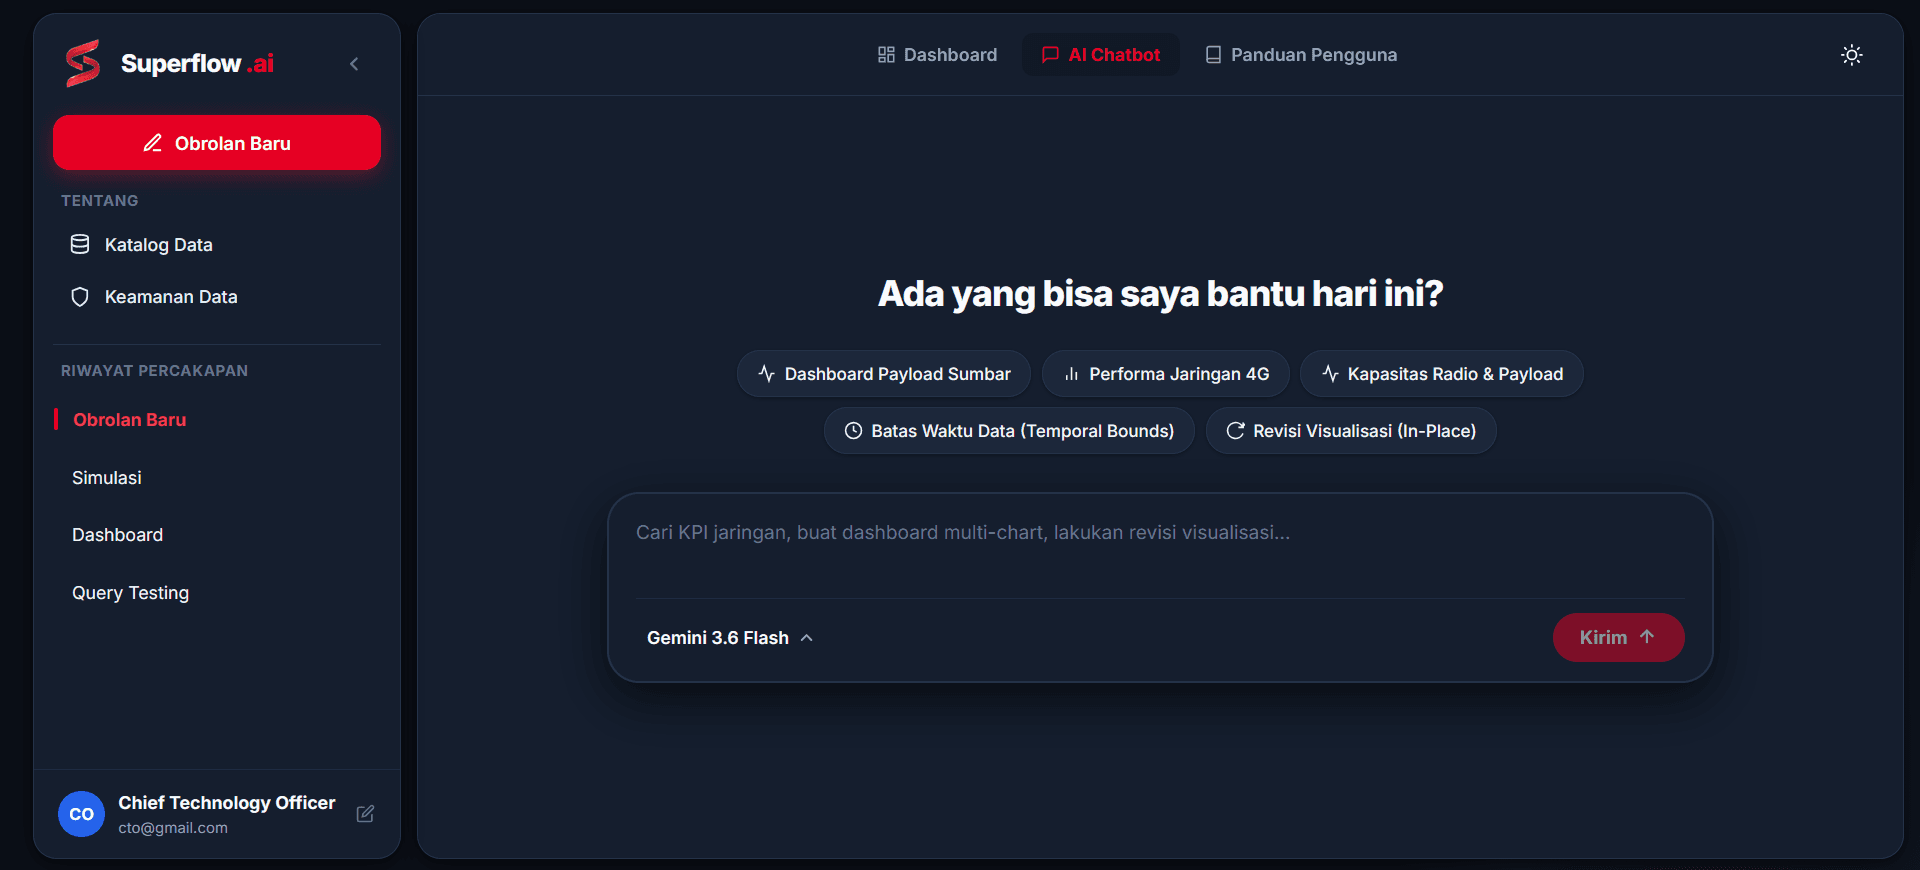
Superflow enforces a strict physical separation between the Control Plane (DDL schema metadata, SQL definitions, and Superset JSON layout AST) and the Data Plane (isolated behind corporate VPN). The AI model never receives or stores raw customer records, and destructive SQL verbs (DROP, DELETE, TRUNCATE, ALTER) are blocked at the lexical parser level.
01 — Executive Overview & Problem Statement
Managing telecom network performance analytics across multi-server PostgreSQL clusters (45+ active schemas and 4,792 analytical tables covering 4G/5G radio capacity, CSSR, DCR, competitor benchmarks, and incident tickets) previously required a manual 15 to 30 minute cycle per dashboard request. Analysts had to manually write complex SQL in Superset SQL Lab, register virtual datasets, configure individual chart slices, and drag-and-drop grid layouts.
Furthermore, minor visual revisions in conventional BI workflows caused severe Dashboard Sprawl (hundreds of duplicate dashboards), while schema changes frequently triggered blind Network Error failures. Superflow Enterprise solves this end-to-end: translating natural-language prompts into verified multi-chart Apache Superset dashboards in 1.5–3.5 seconds with live in-place mutation and autonomous self-healing.
02 — Operational Impact (Manual Process vs Superflow Enterprise)
~2.1 Seconds
Down from 15–30 minutes per multi-chart dashboard request (>85% operational time saved).
< 10 ms
In-memory schema & table catalog lookup across 4,792 tables with zero LLM token consumption.
0% Duplicates
Isolated in-place mutation via PUT /api/v1/dashboard/<id>.
03 — Core System Architecture & Guardrails
Thinking → Action → Observation → Verification
Visualized live in the chat UI via AgenticTraceWidget.tsx, coupled with a Strict Anti-Blindness Guardrail that verifies physical Superset API responses before confirming success.
6-Tier Gemini Multi-Model Cascade
Eliminates rate-limit downtime through automatic tiered fallback across Gemini Flash and Pro model families with session-scoped conversational memory.
Dynamic Grid & Auto-Reflow Guardrail
Manipulates Superset's position_json tree via natural language (“narrow”, “widen”, “full width”), automatically isolating 12-column full-width cards into dedicated rows so adjacent charts never overlap.
Anti-Pattern & Area Bias Mitigation
Prevents Pie/Donut charts on high-cardinality dimensions (>5–7 regions), mitigates Choropleth Map Area Bias via Horizontal Ranked Bar Charts, and supports Confidence Bands, Box Plots, and Treemaps.
04 — Dynamic Tool Dispatcher (11 Integrated Agent Tools)
Registered in src/lib/agentTools.ts to orchestrate live Apache Superset REST APIs and multi-node PostgreSQL introspection:
create_superset_dashboardAutomates virtual dataset registration, multi-chart slice creation, 2x2 grid assembly, and live Apache Superset dashboard publication.
apply_dashboard_advanced_evaluationsApplies advanced statistical visualization transformations concurrently across target dashboards.
troubleshoot_and_fix_chartAutonomously diagnoses and heals SQL query errors, axis mismatches, and invalid temporal filters on non-timeseries tables.
mutate_dashboard_card_layoutMutates Superset AST position_json dimensions (1–12 columns) via natural language with an Auto-Reflow Guardrail.
mutate_superset_chart_vizPerforms isolated in-place chart visualization type mutations via HTTP PUT without creating duplicate slices.
mutate_superset_chart_colorsSynchronizes two-layer corporate and semantic color palettes (Telkomsel Corporate, Bright Vibrant, Luxury Jewel Tone).
apply_table_conditional_formattingInjects dynamic row-level conditional formatting rules (e.g., highlighting Delayed pipeline statuses).
search_superset_assetsReads directly from live Superset REST API (GET /api/v1/dashboard/) to eliminate 100% of stale catalog hallucinations.
get_schema_tables & execute_sql_queryInspects schema metadata and executes strictly sanitized read-only SQL probes across multi-server PostgreSQL clusters.
get_dashboard_sources_and_lineageTraces end-to-end data lineage from upstream PostgreSQL schemas down to individual Superset visualization slices.
get_dashboard_freshness_statusMonitors real-time ETL pipeline freshness and detects delayed data ingestion across production tables.
05 — Engineering Evolution (Sprint 1 — Sprint 9 Roadmap)
Iterative progression from a single-chart generator PoC to a self-healing autonomous conversational BI platform:
Established workflow orchestration, Gemini LLM + Superset REST API integration, 2x2 complementary multi-chart planning, SQL LIMIT/non-destructive guardrails, and corporate color palettes.
Built an in-memory catalog router answering schema queries in <10ms without LLM token overhead, paired with heuristic chart selection (Time-Series → Line, Categorical → Bar, Low-Cardinality → Donut).
Eliminated dashboard duplication via in-place HTTP PUT updates, proactive empty-table detection, and unified multi-server PostgreSQL integration across distributed database clusters.
Migrated to a native Next.js App Router + TypeScript architecture featuring a transparent ReAct Execution Loop (Thinking, Action, Observation, Verification) and interactive Agentic Trace Widget.
Delivered Live Superset Asset Discovery, AST position_json card resizing with Auto-Reflow, Data Visualization Intelligence (mitigating Map Area Bias & Pie anti-patterns), and Autonomous Chart Troubleshooting.